
Particle Size Distribution: How to Read and Interpret a Particle Size Distribution Curve
Particle Size Distribution: How to Read and Interpret a Particle Size Distribution Curve
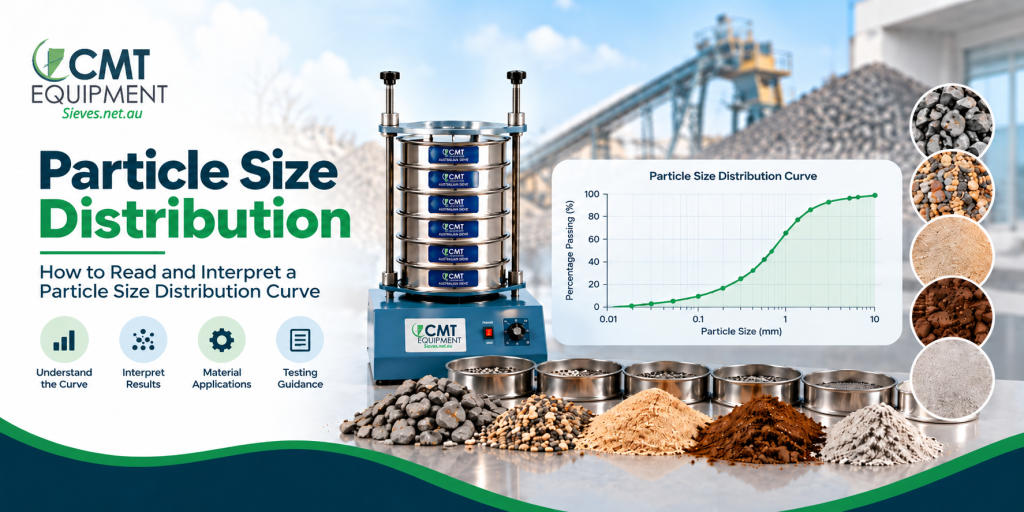
Particle size distribution describes how particles in a material are spread across different size ranges. It provides valuable information about the composition, grading, and behaviour of materials used in construction, mining, agriculture, environmental testing, manufacturing, and research.
However, obtaining the test results is only part of the process. You also need to understand what those results mean. By analysing the particle size distribution, you can identify whether a material contains mostly coarse particles, fine particles, or a balanced combination of different sizes.
A particle size distribution curve makes this information easier to understand. It converts individual test results into a visual representation that shows how particle sizes change across a sample. Therefore, learning how to read this curve can help laboratory professionals, engineers, technicians, and researchers make better decisions about the materials they test.
What Is Particle Size Distribution?
Particle size distribution refers to the proportion of particles within different size ranges in a sample. Instead of describing a material using one particle size, the analysis shows how the entire sample is divided between coarse, medium, and fine particles.
For example, a soil sample may contain gravel, sand, silt, and clay-sized particles. Likewise, a crushed aggregate sample may contain several different particle sizes. Each fraction contributes to the overall characteristics of the material.
Laboratories can determine these proportions through different particle sizing techniques. For larger particles, sieve analysis provides a practical method for separating material according to size. Smaller particles may require additional techniques when they fall below the effective range of conventional sieving.
As a result, particle size data provides a more complete understanding of a material than a single average particle size.
Why Does Particle Size Distribution Matter?
Particle size affects many physical properties of a material. Therefore, understanding the distribution helps professionals predict how that material may behave during processing, handling, construction, or use.
For example, particle size can influence:
- Material strength
- Compaction
- Permeability
- Flow behaviour
- Mixing performance
- Filtration
- Sedimentation
- Surface area
- Packing density
- Processing efficiency
In construction, engineers use grading information to evaluate aggregates and soils. In mining, particle size data helps assess crushed and processed materials. Similarly, manufacturers can use size distribution data to maintain consistency between production batches.
Furthermore, laboratories can compare test results against project specifications or material requirements. This comparison helps identify materials that fall outside the required grading range.
How Is Particle Size Distribution Determined?
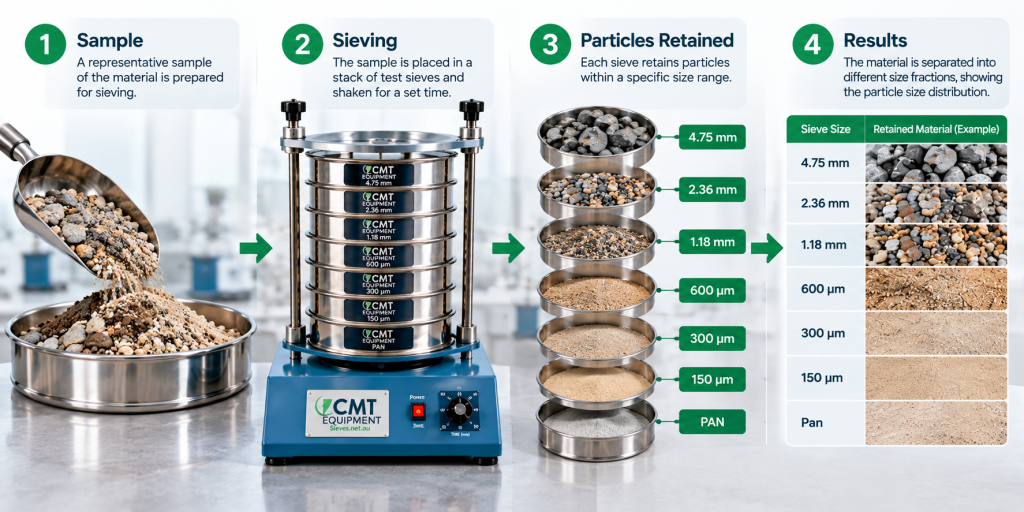
The testing method depends mainly on the size and characteristics of the material.
For coarse and granular materials, laboratories commonly use a series of test sieves with progressively smaller apertures. The sample moves through the sieve stack, and each sieve retains particles that are too large to pass through its openings.
After testing, technicians weigh the material retained on each sieve. They then calculate the percentage retained and percentage passing for each sieve size.
For finer materials, laboratories may need additional particle sizing techniques. In some cases, technicians combine different methods to obtain a more complete representation of the sample.
Therefore, the selected testing method should match the particle size range and characteristics of the material.
Understanding Particle Size Distribution Results
After completing the test, laboratories usually record the results in a table. The table normally includes the sieve aperture, mass retained, percentage retained, and percentage passing.
Consider a simplified example:
| Sieve Size | Percentage Retained | Percentage Passing |
| 4.75 mm | 10% | 90% |
| 2.36 mm | 20% | 70% |
| 1.18 mm | 25% | 45% |
| 600 µm | 20% | 25% |
| 300 µm | 15% | 10% |
| 150 µm | 10% | 0% |
This table shows how the material becomes progressively finer as the aperture size decreases.
The percentage passing value tells you how much of the sample is smaller than a particular particle size. Therefore, a high percentage passing at a given aperture indicates that most of the material consists of particles smaller than that size.
What Is a Particle Size Distribution Curve?
A particle size distribution curve presents the test results as a graph. Typically, the horizontal axis represents particle size, while the vertical axis represents the percentage passing.
The particle size axis commonly uses a logarithmic scale. This approach allows the graph to display a broad range of particle sizes clearly.
The resulting curve provides a quick visual overview of the material. A steep curve can indicate that many particles fall within a relatively narrow size range. In contrast, a flatter curve can indicate a wider range of particle sizes.
Therefore, the shape of the curve can provide useful information about the grading and uniformity of a sample.
How to Read a Particle Size Distribution Curve
Reading the curve becomes easier when you understand what each axis represents.
First, locate the particle size on the horizontal axis. Next, move vertically until you reach the distribution curve. Then, move horizontally toward the percentage passing axis.
The resulting value indicates the approximate percentage of material that passes the selected particle size.
For example, if the curve indicates 60% passing at 1 mm, approximately 60% of the sample consists of particles smaller than 1 mm.
Likewise, approximately 40% of the sample remains larger than 1 mm.
This relationship allows you to interpret the material without examining every individual fraction separately.
What Does the Shape of the Curve Tell You?
The shape of the distribution curve can reveal important characteristics about a sample.
A relatively steep curve usually indicates that the particles occupy a narrower size range. Therefore, the material may have a more uniform particle size.
On the other hand, a flatter curve generally indicates a broader range of particle sizes. The sample may contain a greater mixture of coarse and fine particles.
A curve that extends across a wide particle-size range can indicate well-distributed material. However, the exact interpretation depends on the material, testing method, and applicable specification.
Consequently, technicians should interpret the curve alongside the relevant material requirements rather than relying on its shape alone.
What Are D10, D30 and D60?
Particle size distribution analysis often uses characteristic particle sizes called D-values.
The D10 represents the particle size at which 10% of the material is finer by mass. Similarly, D30 represents the size at which 30% is finer, while D60 represents the size at which 60% is finer.
You can determine these values by locating the relevant percentage on the vertical axis and reading across to the distribution curve. Then, you can identify the corresponding particle size on the horizontal axis.
These values provide useful reference points for comparing different materials.
For example, two samples may have similar average particle sizes but very different distributions. Comparing D-values can reveal differences that an average value may not show.
Understanding the Coefficient of Uniformity
The coefficient of uniformity, commonly represented as Cu, provides a numerical indication of the spread of particle sizes.
For many soil applications, technicians calculate it using:
Cu = D60 / D10
A higher value generally indicates a wider range of particle sizes. A value closer to 1 indicates a narrower distribution.
However, you should not interpret Cu by itself. The material type, applicable classification system, and project requirements also influence the final interpretation.
Therefore, use the coefficient alongside the distribution curve and other relevant test information.
What Is the Coefficient of Curvature?
The coefficient of curvature, commonly represented as Cc, provides another way to describe the shape of a particle size distribution.
The common equation is:
Cc = (D30²) / (D10 × D60)
This calculation uses the D10, D30, and D60 values obtained from the distribution curve.
Together, Cu and Cc can provide additional information about the grading characteristics of certain soil materials.
However, laboratories should always follow the calculation method and classification criteria specified by the relevant testing standard or project specification.
Particle Size Distribution in Soil Testing
Soil behaviour depends heavily on particle size and particle arrangement. Therefore, particle size distribution plays an important role in geotechnical testing.
For example, the proportion of coarse and fine particles can influence drainage, permeability, compaction, and other engineering properties.
A soil containing mostly coarse particles can behave differently from a soil containing a significant proportion of fine particles. Likewise, two soils with similar dominant particle sizes can behave differently because their overall distributions differ.
Consequently, engineers use particle size information alongside other soil tests when evaluating material for construction and geotechnical applications.
Particle Size Distribution in Aggregate Testing
Aggregate grading affects how particles pack together within a mixture. Therefore, construction laboratories regularly evaluate the size distribution of aggregates.
A suitable grading range can help engineers assess whether an aggregate meets the requirements for a particular application.
For example, aggregate testing may evaluate crushed stone, gravel, or sand. The laboratory can compare the measured percentage passing at different sieve sizes with the specified grading limits.
This approach helps identify whether the material contains too many coarse particles, too many fines, or an unsuitable distribution.
Particle Size Distribution in Mining
Mining operations process materials through several stages of crushing, screening, and separation. Consequently, particle size information helps operators understand how effectively these processes work.
For example, a laboratory can compare the size distribution before and after crushing. The results can show whether the process produces the required size range.
Similarly, particle size data can support quality control during mineral processing. By monitoring changes in the distribution, operators can identify variations in production and investigate potential process issues.
Particle Size Distribution in Agriculture
Agricultural and environmental laboratories also use particle size information to study soil and other granular materials.
Soil texture depends partly on the relative proportions of different particle sizes. Therefore, size distribution data can help researchers understand properties such as drainage, water movement, and soil structure.
Similarly, laboratories can analyse materials such as fertilisers, grains, and other agricultural products when particle size affects handling or product performance.
Particle Size Distribution in Manufacturing
Manufacturers often need consistent particle sizes to maintain product quality. For this reason, particle size testing can form an important part of production quality control.
Powders, granules, pigments, minerals, food ingredients, and other materials may require controlled particle size ranges.
If the distribution changes significantly between production batches, the material may behave differently during processing or final use.
Therefore, regular particle size testing can help manufacturers identify variations before they affect the finished product.
Dry Sieving vs Wet Sieving for Particle Size Analysis

The testing method should match the material being analysed.
Dry sieving works well when particles can separate freely without significant moisture or cohesion. However, some materials contain fine particles that stick together or attach to larger particles.
In these situations, wet sieving can help separate the finer material from the larger particles. Water carries the fine fraction through the mesh while the larger particles remain on the sieve.
As a result, wet sieving can provide a more representative result for certain soils, sediments, and materials containing cohesive fines.
However, laboratories should select the appropriate procedure according to the material and applicable testing standard.
Common Problems When Interpreting Distribution Data
Several mistakes can lead to incorrect interpretation.
Looking Only at the Average Particle Size
An average value does not describe the complete distribution. Two samples can have the same average while containing very different proportions of coarse and fine particles.
Therefore, examine the complete distribution whenever possible.
Ignoring the Testing Method
Different particle sizing methods can produce different results when they cover different size ranges or use different principles.
Consequently, always consider how the laboratory obtained the data before comparing results.
Overlooking Sample Preparation
Poor preparation can affect the separation of particles. For example, agglomerated particles may behave as larger particles during testing.
Therefore, appropriate preparation remains essential for meaningful results.
Comparing Results Without Considering Standards
A distribution that appears suitable for one application may not satisfy another specification.
For this reason, compare the results with the applicable standard, specification, or material requirement.
How Accurate Test Equipment Supports Reliable Results
Reliable data starts with suitable testing equipment. Test sieves with controlled aperture sizes help laboratories separate particles consistently. Likewise, suitable sieve shakers can provide controlled movement during the test.
The condition of the sieve also matters. Damaged mesh, blocked openings, or contamination can affect particle separation and therefore influence the final distribution.
For this reason, laboratories should inspect their sieves regularly and maintain them according to their testing procedures.
Certified and calibrated equipment can provide additional confidence when testing requires controlled measurement and traceability.
How to Improve the Reliability of Particle Size Results
Laboratories can improve their results by following a consistent testing process.
First, collect a representative sample. Next, prepare the material according to the applicable procedure. Then, select suitable sieve sizes and testing equipment for the required particle range.
After testing, record the retained masses carefully and check the calculations. Finally, review the distribution curve and compare the results with the relevant specification.
Regular equipment inspection also helps maintain consistency between tests.
By controlling each stage, laboratories can reduce unnecessary variation and produce more dependable particle size data.
Why Particle Size Distribution Curves Are Useful
A table can provide precise numerical results, but a graph makes patterns easier to recognise.
For example, the curve can quickly show whether a sample contains a narrow or broad range of particle sizes. It can also help users compare two or more samples visually.
Furthermore, engineers can use the curve to identify characteristic particle sizes such as D10, D30, and D60.
Therefore, the curve provides a practical way to turn detailed test data into information that supports material evaluation.
Final Thoughts
Particle size distribution provides a detailed picture of how particles are distributed throughout a material. Instead of focusing on one particle size, it shows the relationship between different size fractions across the entire sample.
By understanding the distribution table and curve, you can identify important characteristics such as grading, particle-size range, and characteristic D-values. You can then use this information to support material evaluation across construction, mining, agriculture, manufacturing, environmental testing, and research.
Accurate results depend on more than calculations alone. Representative sampling, suitable testing methods, properly maintained equipment, and careful data interpretation all contribute to reliable results.
At Sieves.net.au, you can find a range of test sieves, sieve shakers, wet washing sieves, and accessories for laboratory and industrial particle size testing. Choosing suitable equipment and maintaining consistent testing practices can help laboratories obtain dependable results for their specific applications.